05. Color Selection

Color Selection Quiz

Question:

In the next quiz, I want you to modify the values of the variables red_threshold , green_threshold , and blue_threshold 
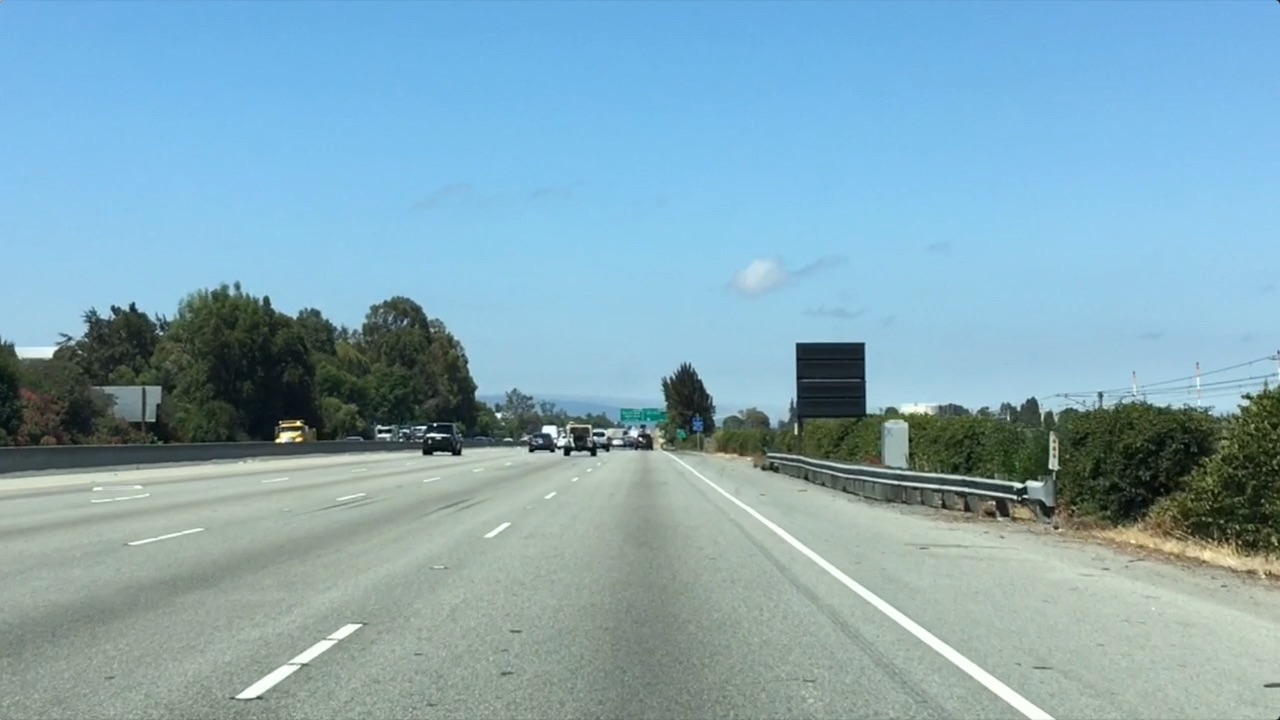
until you are able to retain as much of the lane lines as possible, while getting rid of most of the other stuff. When you run the code in the quiz, your image will be output with an example image next to it. Tweak these variables such that your input image (on the left below) looks like the example image on the right.

The original image (left), and color selection applied (right).

Start Quiz:

import matplotlib.pyplot as plt
import matplotlib.image as mpimg
import numpy as np

# Read in the image
image = mpimg.imread('test.jpg')

# Grab the x and y size and make a copy of the image
ysize = image.shape[0]
xsize = image.shape[1]
color_select = np.copy(image)

# Define color selection criteria
###### MODIFY THESE VARIABLES TO MAKE YOUR COLOR SELECTION
red_threshold = 0
green_threshold = 0
blue_threshold = 0
######

rgb_threshold = [red_threshold, green_threshold, blue_threshold]

# Do a boolean or with the "|" character to identify
# pixels below the thresholds
thresholds = (image[:,:,0] < rgb_threshold[0]) \
            | (image[:,:,1] < rgb_threshold[1]) \
            | (image[:,:,2] < rgb_threshold[2])
color_select[thresholds] = [0,0,0]

# Display the image                 
plt.imshow(color_select)

# Uncomment the following code if you are running the code locally and wish to save the image
# mpimg.imsave("test-after.png", color_select)
Solution:

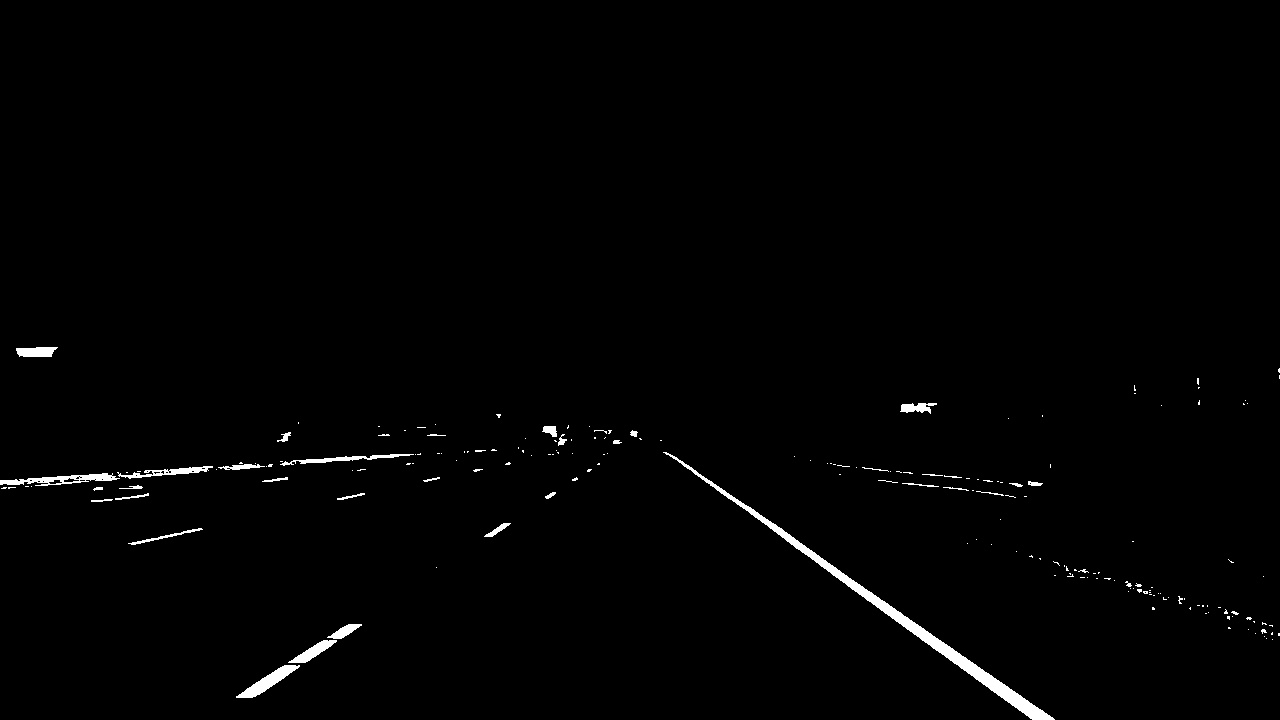
Here's how I did it… I started by just trying some guesses.

Eventually, I found that with red_threshold = green_threshold = blue_threshold = 200 , I get a pretty good result, where I can clearly see the lane lines, but most everything else is blacked out.

At this point, however, it would still be tricky to extract the exact lines automatically, because we still have many other pixels detected around the periphery.

The original image (left), and color selection applied (right).